Amazon CloudFront real-time logs. Import to AWS ElasticSearch Service
How to process your CloudFront logs almost in real-time, using only AWS Managed solutions.
What is that?
Not long ago AWS announced the Real-time logs for it’s CloudFront CDN. We could only use the S3 logs feature before, thus that created some kind of a delay before the data can be actually analysed. This is not always enough for all of the scenarios. Fortunately, the AWS constantly thinking about us :) so they unveiled the solution, that can make our life a bit easier and more real real-time (or something near real-time, the details below).
The task was to provide the easy and fast way to process the CloudFront log data. Ideally - to have a possibility build dashboards and perform some analytics. We decided to export the logs into AWS ElasticSearch service.
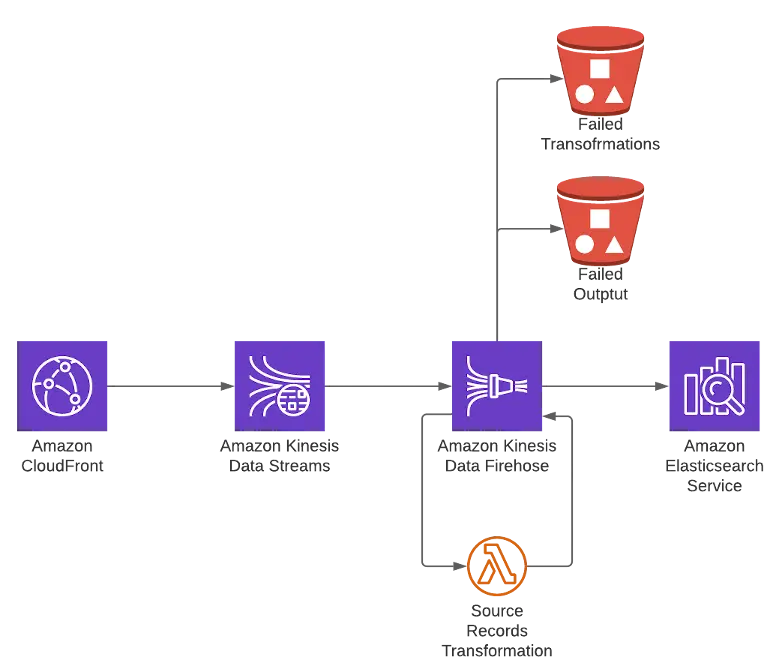
The high-level solution diagram:

Kinesis Data Stream
On the first step, you should prepare the Kinesis Data Stream. Here is nothing special in the configuration – it is pretty “next-next-next” clicks. You should pay attention on the scaling. In our case it was enough to be with 1 shard. One important remark: as the CloudFront is a global service, your Kinesis and ElasticSearch infrastructure should run in us-east-1 region. Probably it is possible to send the data to other region, but in our case we wanted to follow the KISS approach.
Once you have the Kinesis Data Stream – it’s high-time to configure your Kinesis Firehose.
Kinesis Firehose
Some deeper explanation is needed on this step. Kinesis transfers the log data from CloudFront as log entry string. There is no built-in mechanism to transform data from string to JSON (the format suitable for ElasticSearch). So if you will try to export the data without any transformation, you will get the mapper_parsing_exception error. The transformation is made by lambda (hello to AWS, that has no native way to achieve the goal :) ) As you can see from the code below, we took only several log fields from our CloudFront. You may find the full list of available fields in AWS Documentation. from datetime import datetime
import base64
import json
def lambda_handler(event, context):
    output=[]
    flds={}
    fields=[
        'timestamp',
        'c-ip',
        'sc-status',
        'cs-method',
        'cs-protocol',
        'cs-uri-stem',
        'x-host-header',
        'time-taken',
        'cs-user-agent',
        'cs-referer',
        'cs-uri-query',
        'x-edge-response-result-type',
        'x-edge-result-type',
        'c-country']

    for record in event['records']:
        payload = base64.b64decode(record['data']).decode('utf-8')
        values = payload.split('\t')
        for index in range(len(fields)):
            flds[fields[index]] = values[index]
        output_record = {
            'recordId': record['recordId'],
            'result': 'Ok',
            'data': base64.b64encode(json.dumps(flds).encode('utf-8'))
        }
        output.append(output_record)
    return {'records': output}
The function extracts the fields from log entries and forms a JSON object. Make sure, that your fields have the right order. The output should be base64-encoded, otherwise Kinesis will throw the error.
Now let’s speak about buffering. Kinesis Firehose can buffer the data based on the time, or based on the volume. In our case we chose to run on the minimal possible values: 60s or 1MiB. Your settings could vary, depending on your needs.
The last thing here is S3 backup. In case if the record could not be processed by Lambda, or put down to ElasticSearch, they will be recorded to S3 – for future manual processing.
The output configuration is pretty straightforward. You should create the ElasticSearch domain in us-east-1. It is very useful to set-up indices rotation. In our case we chose daily rotation.
There are several settings for ElasticSearch you need to make in order to let it work with Kinesis:
- Create the role in ElasticSearch (for example firehose-role):
{
  "index_permissions": [
    {
      "index_patterns": [
        "cdn-logs*"
      ],
      "dls": "",
      "fls": [],
      "masked_fields": [],
      "allowed_actions": [
        "crud",
        "create_index",
        "manage"
      ]
    }
  ],
  "tenant_permissions": [],
  "cluster_permissions": [
    "cluster_composite_ops",
    "cluster_monitor"
  ]
}
- Create the Role mapping for your Firehose IAM role:
{
  "hosts": [],
  "users": [],
  "backend_roles": [
    "arn:aws:iam::${AWS_ACCOUNT_ID}:role/service-role/${KinesisFirehoseServiceRole}"
  ]
}
After these steps, the logs should be seen in your ElasticSearch cluster. As I mentioned before, this solution will not give you the truly real-time logs ingestion to ElasticSearch. Kinesis still works with batches, and you may achieve near real-time ingestion, that should be enough for the most of the needs.